

A spreadsheet can make an AI business case more disciplined, but only if it counts the full investment. An AI project ROI calculator template for Excel models project costs against expected benefits, then calculates ROI as (total benefits minus total investment) divided by total investment, multiplied by 100%. It turns assumptions into a view of the project’s potential financial return.
This distinction matters when leaders need to separate a compelling use case from one that only sounds promising. Time savings, productivity gains, revenue increases, and ongoing operating costs all affect the result. A useful model makes these inputs visible and easy to adjust.
This guide explains how to build and use an AI project ROI calculator template for IT investment decisions. You’ll learn which costs and benefits to include, how to compare conservative, expected, and optimistic scenarios, and how to use the results in a business case. It also covers ROI’s limits: a calculation can inform a decision, but it cannot replace clear assumptions about adoption, implementation, and operational impact.
Key Takeaways
- Separate one-time implementation expenses from ongoing operating costs so the spreadsheet reflects the full investment.
- Compare conservative, expected, and optimistic assumptions to show decision-makers how outcomes shift with key inputs.
- Include measurable gains such as time saved, higher revenue, and reduced risk, while making the assumptions behind each benefit visible.
- Use industry and use-case examples as reference points, then assess each project against its own workflows, adoption, and operating conditions.
What is AI ROI Calculator Template?
An AI ROI calculator translates operational assumptions into projected financial outcomes. In Excel, it connects baseline performance, investment costs, and expected benefits to estimate return on investment.
-
Identify Calculator Inputs and Outputs
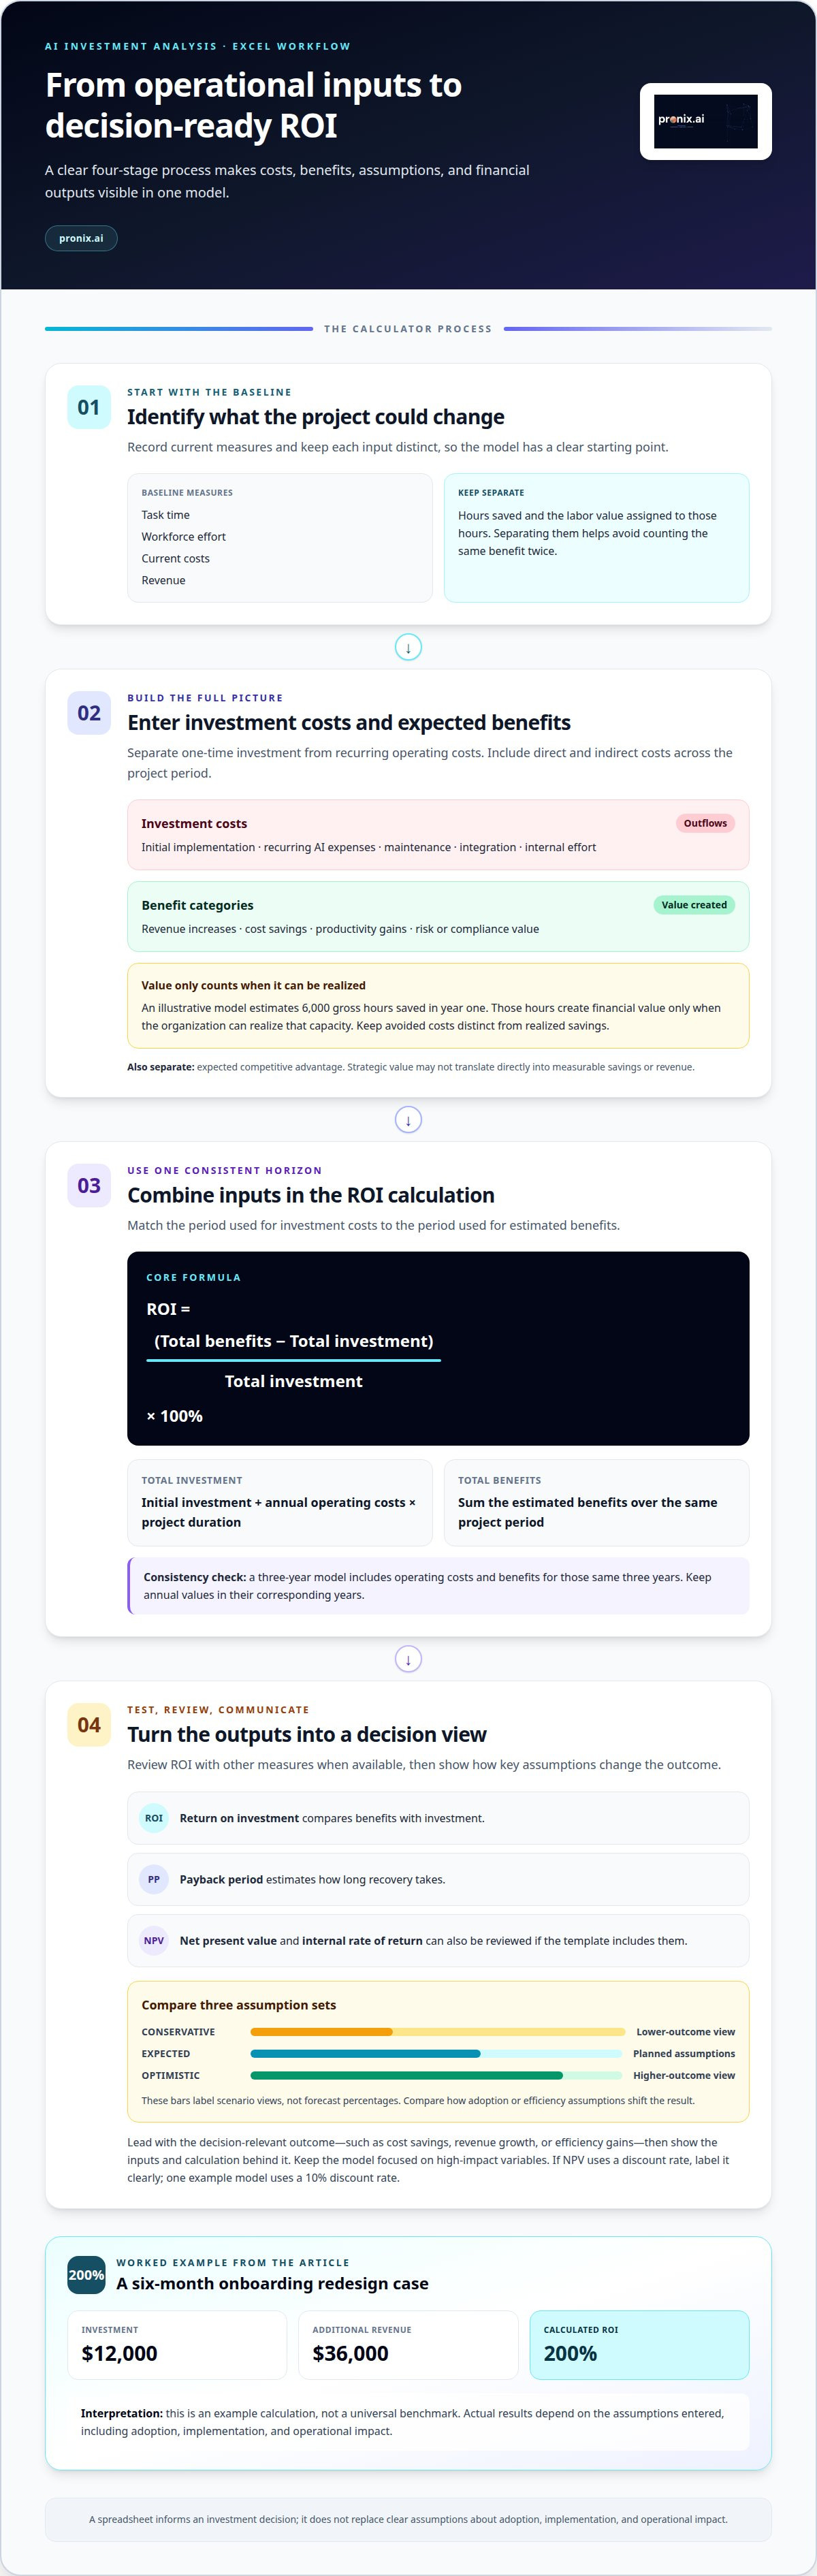
Start by listing the baseline measures the project could change, such as task time, workforce effort, current costs, and revenue. Then identify the spreadsheet’s outputs, such as total investment, total benefits, ROI, and payback period. Keep each input distinct. For example, record hours saved separately from the labor value assigned to those hours to avoid counting the same benefit twice.
-
Enter AI Investment Costs and Benefits
Enter the initial investment, then include annual operating costs across the project period. Account for both direct and indirect costs, not just implementation. For benefits, include revenue increases, cost savings, and productivity gains. Translate time saved into financial value only when the labor assumptions support it. Record expected competitive advantage separately, since strategic value may not translate directly into measurable savings or revenue.
-
Combine Inputs in the ROI Calculation
Calculate total investment as the initial investment plus annual operating costs multiplied by project duration. Sum the estimated benefits for the same period. Then apply the formula: ROI equals total benefits minus total investment, divided by total investment, multiplied by 100%. Keep the time horizon consistent across costs and benefits. A three-year model, for example, should include operating costs and benefits for that same three-year period.
-
Review the Financial Outputs
Review ROI alongside payback period, net present value, and internal rate of return if the template includes them. Each measure shows a different aspect of the decision: ROI compares benefits with investment, while payback estimates how long recovery takes. Test how changes to adoption or efficiency assumptions affect the result. Excel’s adjustable inputs make scenario comparisons easier, but every output depends on the assumptions entered.
Business cases and investment analysis
Use the spreadsheet to connect an IT investment to a decision, not just to produce a percentage. A clear business case links costs, expected outcomes, assumptions, and operational priorities.
-
Calculate Total Investment
Build the investment estimate from initial implementation costs and operating costs across the project period. Include recurring AI expenses, maintenance, integration, and internal effort where relevant. Keep the period consistent: a three-year analysis needs costs and benefits for the same three years. In Excel, separate one-time and recurring entries so decision-makers can see which assumptions drive the total and revise them without rebuilding the model.
-
Build the Business Case
Connect each projected benefit to a business objective, such as increased revenue, improved productivity, or a better user experience. Compare conservative, expected, and optimistic assumptions to show how the case changes when adoption or efficiency differs. For example, an onboarding redesign costing $12,000 and generating $36,000 in additional revenue over six months has a calculated ROI of 200%. Treat that result as an example, not a universal benchmark.
-
Communicate Investment Outcomes
Lead the presentation with the decision-relevant outcome, such as cost savings, revenue growth, or efficiency gains. Then show the inputs and calculation behind it. A concise ROI slide can pair the expected scenario with conservative and optimistic views, making opportunity and risk visible. Keep the model focused on high-impact variables. If a discount rate is used for net present value, label it clearly; one example model uses a 10% discount rate.
For UX and technical investments, measure what changes in the workflow. A referral feature may affect recurring revenue, while a DevOps improvement may create value by reducing manual deployment effort. Tie each benefit to a tracked operational measure, then distinguish productivity gains from direct savings. This gives the business case a practical basis for review and budgeting.
For workflow projects, automation investment planning can connect projected efficiency outcomes to implementation decisions.
Costs and benefits included in the model
Build the model around costs and benefits the organization can connect to operational evidence. A three-year comparison can show how development and monthly AI costs relate to projected value.
-
Identify Model Costs and Benefits
Separate implementation and development expenses from recurring operating costs. Include direct and indirect costs, such as internal effort and the work required to support the system. Then identify benefits the organization can measure, rather than treating every projected improvement as cash savings. For example, an illustrative model estimates 6,000 gross hours saved in year one, but those hours only create financial value when the organization can realize that capacity.
-
Map Benefits to Value Categories
Group expected benefits into revenue increases, cost savings, productivity gains, and risk or compliance value. This structure shows how each outcome contributes without blending unlike measures. Keep avoided costs distinct from realized savings, and document the operational assumption behind each category.
-
Calculate Total Benefits
Add revenue increases, cost savings, and productivity gains to calculate total benefits for each period. Keep annual values in their corresponding years, so the spreadsheet does not combine a one-time gain with recurring value. This comparison reveals the gap between expected value and investment before the organization assesses payback.
Review assumptions before treating the result as a forecast. If saved hours cannot be redirected or cost reductions cannot be realized, adjust the expected benefit. A three-year model without discounting compares benefits against development and monthly AI costs over that period. Label the method clearly so readers understand how timing affects the analysis.
AI project ROI benchmarks by industry or use case
Use case examples can help calibrate a model, but they are not universal benchmarks. Compare each project’s workflow, costs, and measurable outcomes before applying an example.
- Use manufacturing automation to test a payback model. The calculator estimates payback in approximately eight months and three-year ROI above 300%. Treat these figures as one scenario, then model your own production volume, defect costs, and operating assumptions.
- Assess productivity use cases through labor hours and realized value. A product lifecycle management example costs $20,000 annually and saves 500 work hours valued at $50,000, producing a calculated annual ROI of 150%. A separate architecture migration example projects $100,000 in annual savings against a $50,000 investment, for 100% annual ROI. Compare the mechanisms, not just percentages: hours reclaimed and costs avoided affect operations differently.
- Compare customer-facing features by revenue and adoption. A referral feature example costs $25,000 and generates $60,000 in recurring revenue over three months, with a calculated ROI of 140%. Another referral scenario projects 1,000 new users over six months. Keep user growth separate from revenue until the model connects adoption to monetized outcomes. This prevents projected reach from being counted as realized financial benefit.
- Use examples to frame questions, not to promise matching returns. A strong comparison names the workflow, investment period, benefit measure, and operating assumptions. Test whether your organization can reproduce the underlying savings, productivity, or revenue mechanism. For an automation use case, assess AI business automation against the workflow and value measures your model needs.
Pronix.ai
pronix.ai helps enterprise teams connect AI investment decisions with the strategy, implementation, and operational foundations needed to move projects toward production. When a spreadsheet points to a promising use case but teams need to assess readiness, data requirements, or implementation pathways, its Agentic AI Strategy & Consulting and Data & AI Foundations offerings can help shape the next decision. For projects moving beyond analysis, Agentic AI Implementation and AI Business Automation support execution and workflow integration.
The right next step depends on the gap your analysis reveals. A project may need stronger data foundations, a defined implementation path, or a clearer link between projected value and operational change. Contact pronix.ai to discuss how to advance your AI investment priorities.
Turn the investment case into a delivery decision
A spreadsheet is most useful when it shapes what happens next: which business outcome to target, what capabilities must support it, and how the organization will assess progress. Use your AI project ROI calculator template as a decision tool, then connect its assumptions to an accountable implementation path. This keeps projected value tied to operational change instead of leaving the business case as a standalone estimate.
When the next step is moving an enterprise AI initiative toward production, pronix.ai offers Agentic AI Implementation, AI-Driven CX Modernization, and AI Business Automation. These services address different transformation needs, from implementing agentic workflows to modernizing customer experiences and automating business processes.
Discuss your AI project with pronix.ai to explore a practical path from investment analysis to execution. A clear decision today can create a stronger foundation for the next stage of your AI program.
Frequently Asked Questions
How accurate are the estimates?
Estimates are only as accurate as their underlying operational data and assumptions. For example, if a support workflow’s baseline volume comes from a representative period, seasonal fluctuations can change projected savings. Strengthen the model by using comparable time periods, identifying data owners, and recording how each estimate was derived. Revisit inputs as actual adoption and performance data become available, then compare observed results with the original forecast.
Is this tool free?
The calculator can be used repeatedly at no cost to assess different investment scenarios. That makes it practical for comparing projects or testing how changed assumptions affect a decision. Free use does not mean every template includes the same features or financial metrics. In Excel, review the workbook’s formulas and input fields before relying on its outputs, especially when adapting a downloaded file for internal budgeting.
What is an AI project ROI calculator template, and when should you use one?
An AI project ROI calculator template is a reusable model for assessing a proposed AI investment against its anticipated business value. Use it during project prioritization, budget planning, or business-case development, especially when stakeholders need a consistent way to compare initiatives. In Excel, a template can make assumptions visible and support scenario changes. It is most useful before approval, while teams can still adjust project scope or sequencing.
What is an enterprise AI ROI calculator?
An enterprise AI ROI calculator is a financial model for assessing AI initiatives across organizational workflows, teams, and operating requirements. It can help decision-makers account for dependencies such as data readiness, integration effort, user adoption, and ongoing governance. For example, a customer-service initiative may affect both agent workload and customer experience. A useful enterprise model separates these outcomes so leaders can assess financial value alongside operational impact.
What is the typical payback period of an AI project?
Well-scoped AI projects in the SME projects tracked in one example typically pay back within 3 to 12 months. That range is a reference for those projects, not a universal timetable for enterprise investments. Payback depends on implementation and operating costs, adoption, and when benefits begin to accrue. A project with gradual rollout or longer integration work may recover its investment on a different schedule than a narrowly scoped workflow change.
Should I use an Excel or Google Sheets ROI calculator?
Choose a spreadsheet your team can maintain, review, and govern effectively. Excel may suit organizations that already manage investment models in workbooks, while Google Sheets can support shared editing when teams need to collaborate in a common file. In either format, protect formula cells, label assumptions, and distinguish input fields from calculated outputs. Change an assumption to confirm the model updates as intended.