

Measure contact center automation by its effect on customer outcomes and operating performance, not containment alone. Track CSAT, NPS, first-contact resolution, agent productivity, and operating leverage against baseline measures. A disciplined approach to measuring contact center automation success starts with capturing baseline performance during the first 30 days, before AI is switched on.
It’s reasonable to expect automation to improve efficiency, but faster handling matters only when customers still receive effective support and agents can resolve issues well. Measuring contact center automation success means reading performance signals together, connecting them to business objectives, and separating genuine operational gains from work that has merely shifted elsewhere.
Customer feedback and first-contact resolution reveal experience quality, while handle time, productivity, and cost per resolution show operational impact. Analytics can surface patterns across interactions, but trusted data, connected workflows, and ongoing monitoring are what turn those measures into a practical view of ROI.
Key Takeaways
- Pair CSAT and NPS with customer comments to see not just whether sentiment changed, but what shaped it.
- Measure first-contact resolution alongside repeat contacts to tell whether automation is resolving issues or shifting work to another channel.
- Assess agent productivity and operating leverage together, so efficiency gains don’t obscure effects on service quality or workload.
- Build an ROI view around baseline performance, business objectives, and ongoing monitoring to identify which automation outcomes merit scaling.
Customer satisfaction metrics, including CSAT and NPS
CSAT and NPS show how customers perceive automated service. Read them alongside routing, resolution quality, and feedback to understand the experience behind the scores.
CSAT and NPS measurement
CSAT measures satisfaction with a specific interaction, while NPS measures willingness to recommend a company. Together, they distinguish the quality of a service encounter from broader customer sentiment.
A CSAT survey can ask customers to rate their latest interaction on a scale of 1 to 10. A one-question survey can also use a 1-to-5 satisfaction ranking for concise feedback. NPS asks customers how likely they are to recommend a company. Keep each measure tied to a clear interaction or customer relationship, then compare results across channels and inquiry types.
For example, compare chatbot ratings for status checks with ratings for billing questions. Zendesk reports that 73% of people will switch to a competitor after bad customer service experiences, making poor feedback a signal to investigate. Review comments alongside scores to identify friction in customer identification, routing, or follow-up.
Satisfaction and resolution quality
Resolution quality shows whether the customer’s issue was addressed accurately and completely, not just whether the interaction ended. A quick response can still leave a customer dissatisfied if the problem remains unresolved.
Connect each satisfaction response to the inquiry’s outcome and any later contacts. For example, a customer may rate an automated password reset highly when access is restored, but poorly if the process fails and offers no useful next step. Match follow-up to the customer’s identity, issue, and prior interaction so the service experience stays coherent.
Separate feedback about waiting, effort, and resolution. A low score after a transfer may point to routing; a low score after an apparently completed exchange may signal an incomplete answer. These distinctions help teams improve the process that affected satisfaction instead of treating every negative response as the same problem.
Service experience in automated support
Automated support shapes satisfaction through the ease, accuracy, and continuity of chatbot and AI-assisted interactions. Measuring that experience matters because automation must deliver useful outcomes, not merely deflect inquiries.
Test automated systems on common requests, such as appointment scheduling, and ask customers whether the interaction met expectations. Track scores by task and channel, then review comments for unclear prompts, incorrect answers, or failed handoffs. A chatbot that identifies a customer’s intent but routes the inquiry incorrectly creates friction, even if it responds quickly.
When an automated interaction needs human follow-up, preserve the customer’s context so they don’t have to repeat the issue. Review satisfaction alongside handoff feedback to find where the transition breaks down. This gives customer service teams practical evidence to refine the experience while keeping complex inquiries visible.
First-contact resolution
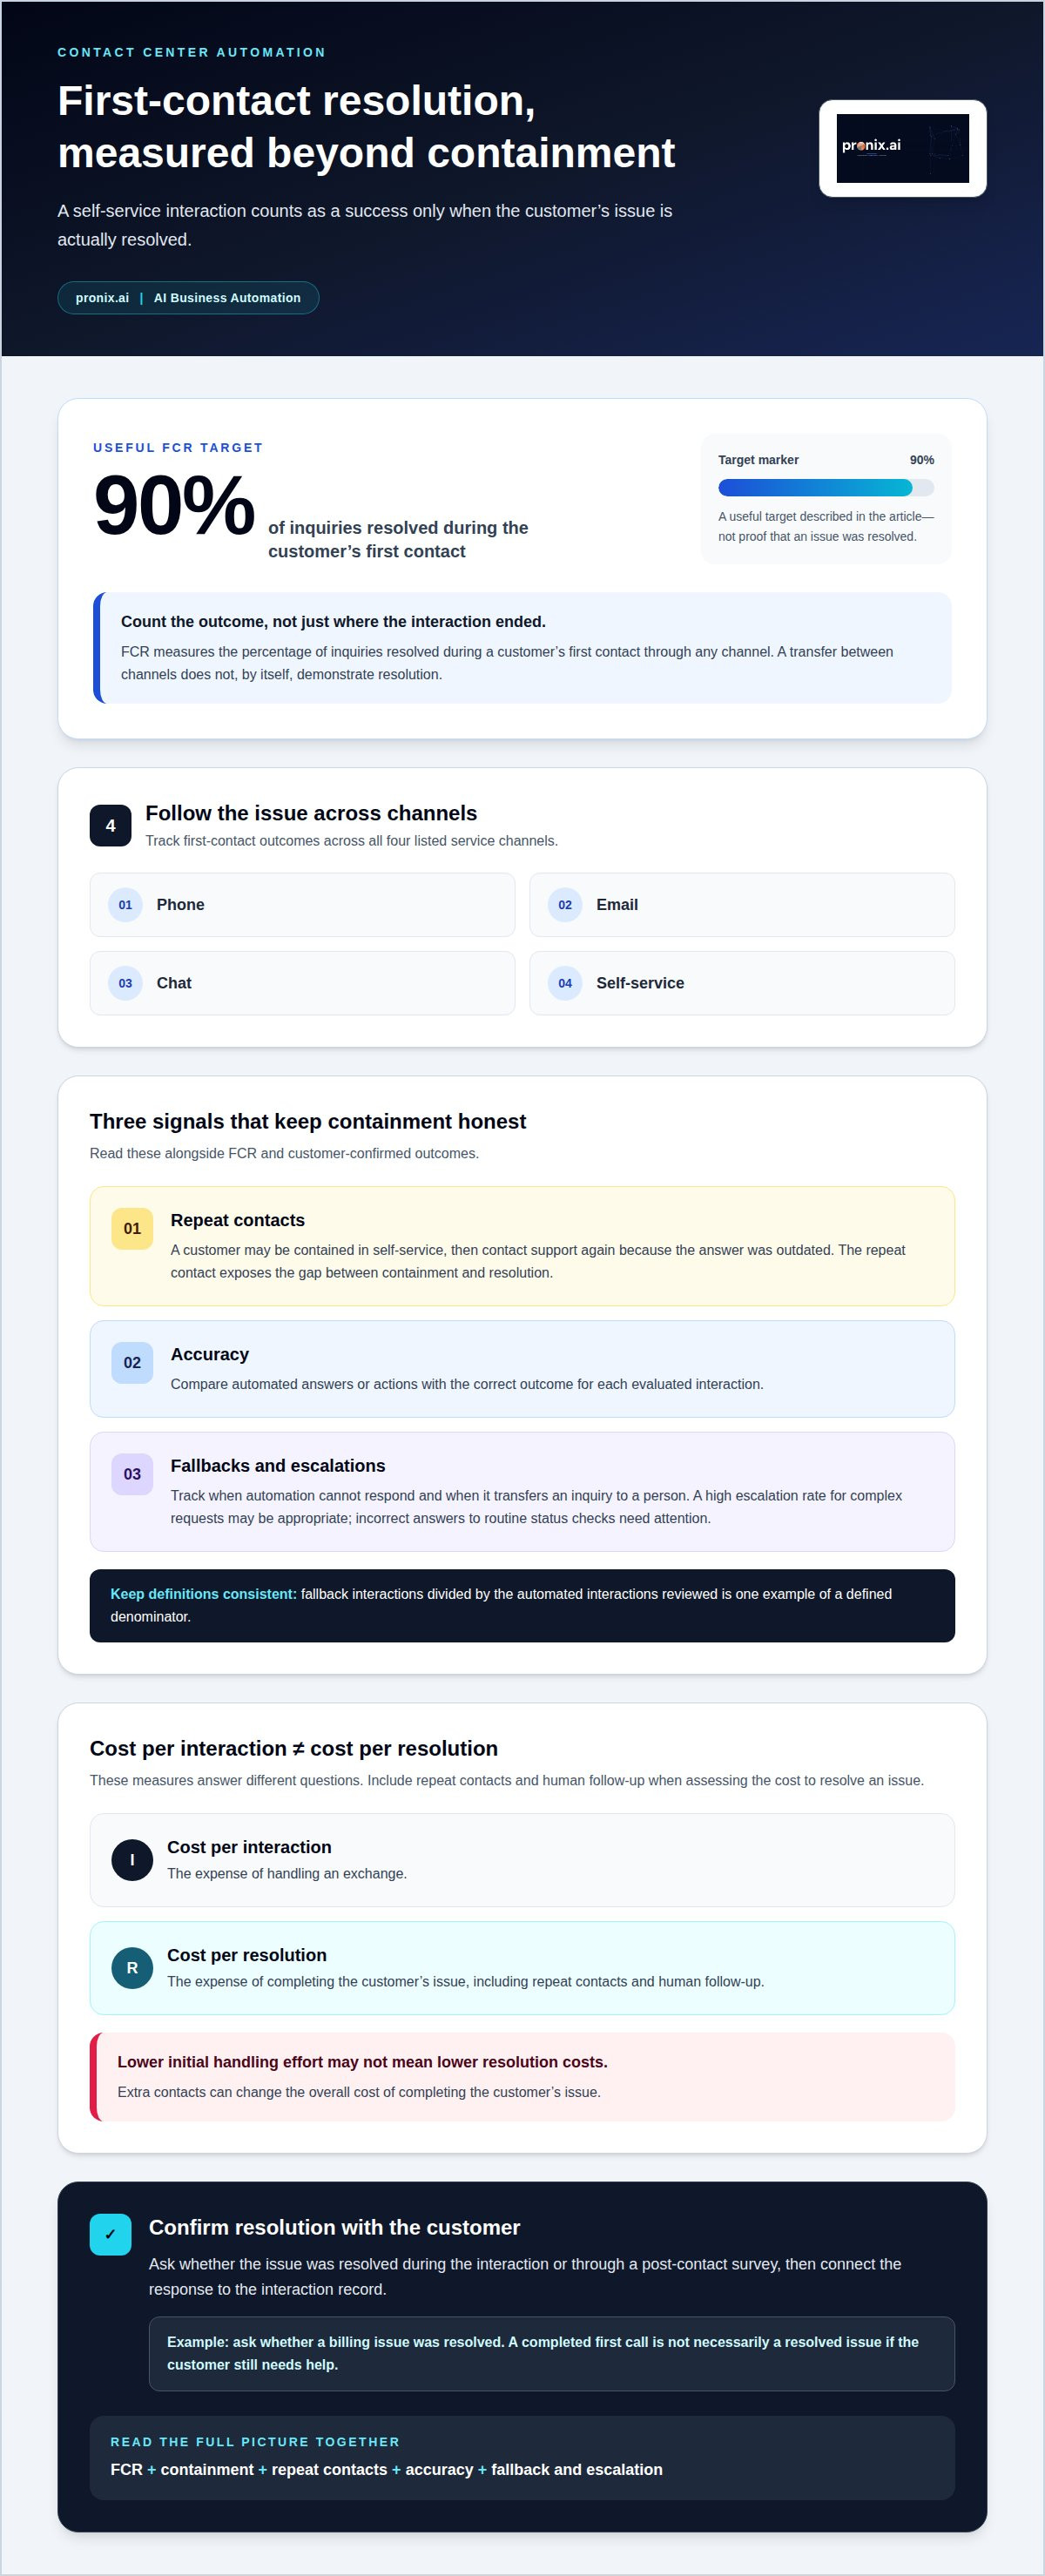
First Contact Resolution (FCR) measures the percentage of inquiries resolved during a customer’s first contact through any channel. A useful target is resolving 90% of inquiries during that first contact. Track the outcome across phone, email, chat, and self-service so a channel transfer doesn’t appear to be a successful resolution.
Containment rate measures how often an automated interaction stays within self-service, but containment alone doesn’t prove resolution. Compare it with FCR, repeat contacts, and customer-confirmed outcomes. For example, a chatbot may contain a package-status request, but the customer may contact support again if the information is outdated. That repeat interaction reveals a gap between containment and resolution.
Measure accuracy by comparing automated answers or actions with the correct outcome for each evaluated interaction. Track fallback when the system can’t respond and escalation when it transfers an inquiry to a person. Use consistent definitions and denominators, such as fallback interactions divided by the automated interactions reviewed. Segment results by inquiry type and channel: a high escalation rate for complex requests may be appropriate, while incorrect answers to routine status checks need attention.
Cost per interaction and cost per resolution reveal different effects. Cost per interaction captures the expense of handling an exchange; cost per resolution captures the expense of completing the customer’s issue. Include repeat contacts and human follow-up in the resolution measure. If a platform reduces initial handling effort but leads to extra contacts, lower interaction costs may not mean lower resolution costs.
Confirm FCR directly with customers during the interaction or through post-contact surveys. For example, ask whether a billing issue was resolved, then connect the response to the interaction record. This distinguishes a completed first call from one after which the customer still needs help. Change routing or automation only after the underlying failure pattern is clear, then monitor FCR, containment, accuracy, fallback, and escalation together.
Agent productivity and operating leverage
Productivity metrics show whether automation gives agents more capacity for valuable work. Operating leverage emerges when routine tasks take less manual effort while service quality remains visible.
Agent efficiency and productivity
Agent efficiency measures how effectively employees use their time and tools to resolve customer needs. Track average handle time across channels alongside service level, occupancy, and time to proficiency. A shorter interaction can signal better efficiency, but only if repeat work and quality remain stable. For example, compare handle time for similar inquiry types before and after introducing agent-assist tools.
Context matters: a change in inquiry complexity can affect handle time even when agent performance is unchanged. Segment metrics by channel and task, then review how routing and automated summaries affect the work agents complete.
Agent productivity and experience
Agent experience influences productivity because access to clear guidance and usable workflows affects how smoothly employees serve customers. The Gitnux Market Data report says contact center agents spend an average of 37% of their time doing unproductive work. Identify avoidable effort, such as searching several systems for an answer, before treating speed as the only measure.
Unified data can lead to a 10% increase in employee productivity. In practice, connected customer context can help an agent find relevant information without repeating searches across tools. Pair output metrics with agent feedback to see whether automation removes friction or adds steps.
Access to knowledge is a practical productivity lever. A centralized knowledge management solution can give agents consistent answers during live interactions. Track how often agents consult knowledge, whether they need repeated searches, and how those patterns relate to handle time and resolution outcomes. If a policy answer is hard to find, improve its organization before expecting agents to respond faster.
Assess operating leverage with a balanced set of measures: average handle time, occupancy, service level, agent retention, and time to proficiency. Read them together. For example, rising occupancy alongside falling service levels may mean workload is outpacing available capacity. Productivity gains matter when they create room for complex customer needs, not simply when agents handle more interactions.
Measuring contact center automation success and ROI
A credible ROI view connects service outcomes and operating costs to business objectives. Compare each result with a baseline and the purpose of the measurement.
Measurement plans and baselines
A measurement plan defines the outcomes, metrics, and review periods used to assess automation. It gives teams a comparable starting point before they attribute changes to AI.
During Days 1-30, before AI is switched on, capture self-service resolution, average handle time, first-contact resolution, agent retention, and customer satisfaction. Link each measure to an objective, such as cost reduction or service quality. Review trends across the first-year periods: days 1-30, 31-90, 91-180, and 181-365. By days 181-365, all five metrics should be readable against their baseline.
Performance across channels
Cross-channel measurement compares outcomes for equivalent customer needs across voice, chat, and email. It matters because channel mix and inquiry complexity can distort a blended result.
Segment analytics by channel and task, then compare resolution, recontacts, satisfaction, and cost per resolution. For example, compare routine account questions across chat and voice instead of comparing chat’s simple requests with complex phone cases. Use consistent outcome definitions and review workflows, handoffs, and follow-ups. This reveals whether a channel performs differently or simply handles a different workload.
Automation success benchmarks
Benchmarks are reference targets tied to defined outcomes, not universal pass-or-fail scores. They help leaders set measurable expectations without mistaking containment for completed service.
For appropriate routine contact types, the Year 1 target for self-service resolution is 30-50%. Status checks, scheduling, and FAQs are examples of suitable routine interactions. Pair that target with recontact rates and customer satisfaction to detect unresolved issues. Treat the range as a planning reference, then interpret performance against inquiry type, channel, and baseline trends.
Automation performance and ROI
ROI connects operational results with the resources used to achieve them. It matters because lower handling effort alone can hide repeat contacts or poor customer outcomes.
Assess cost per resolution, containment, time to proficiency, recontacts, and customer satisfaction together. Use analytics to identify trends, then trace changes to the workflows that produced them. If containment rises while recontacts also increase, the apparent efficiency may conceal incomplete resolutions. For a measurement-led automation plan, align automation workflows with business outcomes and ongoing performance review.
Pronix.ai: AI Business Automation
pronix.ai is a practical next step when contact center metrics point to workflows that need redesign, automation, or stronger data foundations. Its AI Business Automation and Agentic AI Implementation services address workflow automation, while AI-Driven CX Modernization focuses on customer experience processes. Data & AI Foundations support the trusted data and connected workflows needed to measure performance consistently.
Turn to these services when pilot results are difficult to compare, customer journeys cross disconnected systems, or teams need a clearer path from measurement to production. The work connects automation priorities with business objectives and operational measures, giving leaders a structured basis for decisions about refinement and scale.
Contact pronix.ai to discuss your contact center automation priorities.
Turn measurement into your next operating decision
Make measurement part of how the contact center evolves, not a report reviewed after decisions are made. Use the evidence to identify workflows that need refinement, where human judgment remains essential, and what to evaluate before expansion. This discipline gives leaders a clearer basis for adapting automation as customer needs and operations change.
For organizations ready to connect measurement with execution, pronix.ai offers AI Business Automation, Agentic AI Implementation, and AI-Driven CX Modernization. These services support work spanning workflow design, implementation, and customer experience modernization. Start a conversation with pronix.ai to define where to begin and which operational outcomes matter most.
Contact pronix.ai to discuss your goals and take the next step toward measuring contact center automation success with a clear operational purpose. Your measurement approach can become a practical foundation for steady, evidence-led progress.
Frequently Asked Questions
How can technology aid in performance measurement?
Technology can combine interaction records, workflow events, and customer feedback into a shared performance view. Analytics can flag patterns such as repeated transfers after a specific intent or inconsistent outcomes for one request type. For example, linking a chatbot transcript to its follow-up agent interaction helps leaders see where the journey breaks, rather than treating each channel’s report as a separate story.
How will future trends impact performance metrics in call centers?
As AI handles more multi-step tasks, measurement needs to capture task completion, accuracy, handoff quality, and customer effort, not just response speed. Connected interactions also make journey-level analysis more useful than channel-only reporting. For example, evaluate a voice assistant that starts a request and a human agent who completes it as one customer journey, with clear attribution for each contribution.
What are the challenges in measuring call center success?
Common challenges include inconsistent metric definitions, disconnected systems, missing interaction context, and changes in inquiry mix. A rise in average handle time might reflect harder cases rather than weaker performance. Teams can reduce misinterpretation by documenting event definitions, segmenting results by request type, and reviewing a sample of interaction records. This helps distinguish a genuine operational change from a reporting or workload shift.
What KPIs measure contact center automation success?
Useful KPIs cover customer outcomes, operational performance, and automation reliability. Consider customer satisfaction, recommendation intent, resolution and recontact rates, handle time, queue time, containment, fallback, escalation, and cost per resolution. Choose measures that connect to the business objective. For example, when the goal is to reduce repeat work, track repeat contacts alongside successful task completion instead of treating automation volume as the outcome.
How do you calculate automation containment and self-service resolution rates?
Calculate containment by dividing automated sessions completed without human assistance by all eligible automated sessions, then multiply by 100. Calculate self-service resolution by dividing sessions where the customer’s need was resolved through self-service by all eligible self-service sessions, then multiply by 100. Define exclusions consistently, including abandoned sessions and transfers, so teams can compare periods without changing the denominator.
How do you measure customer satisfaction for automated contact center interactions?
Ask customers to rate the automated interaction after it ends, then connect each response to its task, channel, and outcome. A concise prompt such as “How satisfied were you with completing your request?” can surface friction without confusing the score with overall brand sentiment. Review written comments alongside ratings, especially for failed tasks, handoffs, and cases where customers had to repeat information.